
We’ve all used Java thread dumps, but how are the values we see captured internally? What do those fields really mean? In this post, as part of my “Hacking the JVM” series, I’ll take a look under the hood of the JDK 17 source code. We’ll decode the mystery behind key thread dump fields, understanding exactly how the JVM tracks and reports on its threads.
"Monitor Ctrl-Break" #19 daemon prio=5 os_prio=31 cpu=18.48ms elapsed=4.22s tid=0x0000000139809600 nid=28419 runnable  [0x000000016f8b2000]
   java.lang.Thread.State: RUNNABLE
	at sun.nio.ch.SocketDispatcher.read0(java.base@21.0.6/Native Method)
	at sun.nio.ch.SocketDispatcher.read(java.base@21.0.6/SocketDispatcher.java:47)

	at java.util.concurrent.ThreadPoolExecutor$Worker.run(ThreadPoolExecutor.java:628)
	at org.apache.tomcat.util.threads.TaskThread$WrappingRunnable.run(TaskThread.java:61)
	at java.lang.Thread.run(Thread.java:834)
Let’s break down each field
| Field Name | Description |
|---|---|
| “Monitor Ctrl-Break” | Name of the Thread |
| #19 | Java Thread id |
| daemon | Optionally present, if daemon |
| prio=5 | Java level priority |
| os_prio=31 | OS Level Priority |
| cpu=18.48ms | CPU time used by thread |
| elapsed=4.22s | Wall time since thread started |
| tid=0x00007f8c0c567800 | Thread Address |
| nid=0x9abc | Native Thread id |
A rough attempt at sketching the understanding
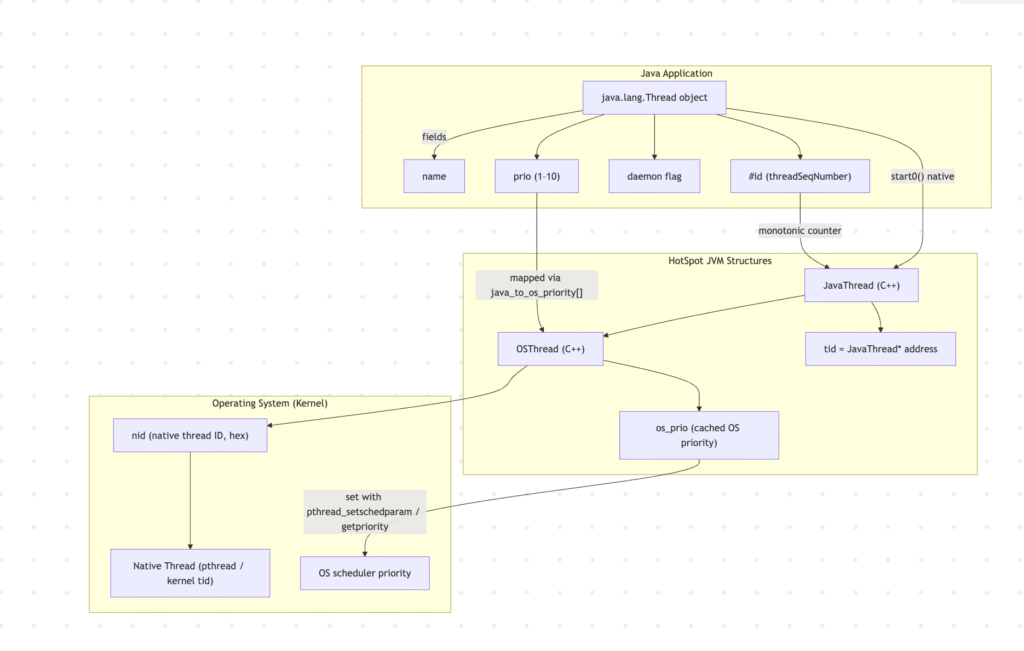
Let’s dive deeper into the each field
Thread Name
The first quoted string (“Monitor Ctrl-Break”) is the thread’s name. You can give names explicitly when constructing a Thread or later using setName().
public Thread(String name) {
   this(null, null, name, 0);
}
What happens if you don’t assign a name?
If no name is provided, a thread is given a name like “Thread-”<sequenceNumber>.
This sequence number is a comes from within the Thread class, which is incremented each time it is called.
Source
private static int threadInitNumber;
private static int threadInitNumber;
private static synchronized int nextThreadNum() {
   return threadInitNumber++;
}
Java Thread Id
The number after # is the Java Thread id. This is a monotonically increasing sequence incremented for each Thread created since the beginning of the JVM.
It’s a simple counter increment in Thread.java
/* For generating thread ID */
private static long threadSeqNumber;

private static synchronized long nextThreadID() {
   return ++threadSeqNumber;
}
So #19 means this was the 19th thread created since the JVM started.
Daemon status
If a thread is set to a daemon, daemon is displayed, else it is omitted.
Java Thread Priority (prio)
This is the priority you can set via Thread.setPriority(1-10). By default, it’s 5. It’s just a hint to the JVM and OS, not a hard guarantee.
OS Thread Priority (os_prio)
This is the thread’s scheduling priority at the native layer. HotSpot uses mapping tables (java_to_os_priority[]) to translate Java’s 1–10 values into OS scheduler values.
The printed os priority comes from OS specific class. For example, following is snippet for Linux
OSReturn os::get_native_priority(const Thread* const thread,
                                 int *priority_ptr) {
  if (!UseThreadPriorities || ThreadPriorityPolicy == 0) {
    *priority_ptr = java_to_os_priority[NormPriority];
    return OS_OK;
  }

  errno = 0;
  *priority_ptr = getpriority(PRIO_PROCESS, thread->osthread()->thread_id());
  return (*priority_ptr != -1 || errno == 0 ? OS_OK : OS_ERR);
}
CPU
This is the cumulative CPU time consumed by this thread, measured by the OS. The unit is milliseconds
st->print("cpu=%.2fms ",
         os::thread_cpu_time(const_cast<Thread*>(this), true) / 1000000.0
         );
Elapse time
This is the wall‑clock time since the thread started, not since JVM startup.
HotSpot records the thread’s start time and then at dump time prints the difference from current time.
st->print("elapsed=%.2fs ",
         _statistical_info.getElapsedTime() / 1000.0
Thread Address (tid)
Despite the name, this isn’t a “thread ID”. It’s actually the memory address of the JavaThread structure inside HotSpot. The dump prints it by converting the pointer to a number.
Practical tip: This is the field you can use to correlate a JVM thread with what the operating system reports.
P2i is present in globalDefinitions.hpp
st->print("tid=" INTPTR_FORMAT " ", p2i(this));

// Convert pointer to intptr_t, for use in printing pointers.
inline intptr_t p2i(const volatile void* p) {
 return (intptr_t) p;
}
Native Thread Id (nid)
This field indicates the native thread id or kernel thread id in hex. On Linux, it’s the value you’d also see from ps -L or top -H. It comes from the native OSThread object where HotSpot caches the real OS ID. The function also prints additional information about the state.
void OSThread::print_on(outputStream *st) const {
 st->print("nid=0x%x ", thread_id());
 switch (_state) {
   case ALLOCATED:               st->print("allocated ");                 break;
   case INITIALIZED:             st->print("initialized ");               break;
   case RUNNABLE:                st->print("runnable ");                  break;
   case MONITOR_WAIT:            st->print("waiting for monitor entry "); break;
   case CONDVAR_WAIT:            st->print("waiting on condition ");      break;
   case OBJECT_WAIT:             st->print("in Object.wait() ");          break;
   case BREAKPOINTED:            st->print("at breakpoint");               break;
   case SLEEPING:                st->print("sleeping");                    break;
   case ZOMBIE:                  st->print("zombie");                      break;
   default:                      st->print("unknown state %d", _state); break;
 }
}
Wrapping Up
That was my walk‑through where each thread dump field comes from in JDK 17.
At first, these numbers seemed mysterious; but once I dug into the HotSpot source, I found each one has a straightforward place inside the JVM.💡 Trivia: Not all threads in a dump have a Java ID (#id). Why? That’s something I’ll explore in a future post as I continue hacking the JVM.
One thought on “[Hacking the JVM] Decoding Java Thread Dumps”